


In the mid‐1980s, New Zealand was forced into a major economic restructuring. Those adjustments were particularly significant for the traded goods sector, since export subsidies and import barriers were largely eliminated. Some may see the UK's possible trade restructuring after Brexit as retracing some of New Zealand's steps.
Today, largely as a result of the reforms undertaken 30 years ago, New Zealand ranks very highly in many world rankings, such as personal and economic freedom, including freedom of trade, ease of doing business, absence of corruption, compliance with the rule of law, protection of property rights, and democratic stability.
Table 1 puts New Zealand's scores (out of 10) and rankings in 2016 for personal and economic freedom in the context of those for the six mainly English‐speaking member countries of the OECD. The table includes Hong Kong and Singapore because of their British colonial heritage and high scores and rankings.
Table 1. Freedom scores and rankings in 2016 for eight OECD countries
| Country | Human freedom | Personal freedom | Economic freedom | |||
|---|---|---|---|---|---|---|
| Score | Rank | Score | Rank | Score | Rank | |
| Australia | 8.58 | 4 | 9.18 | 11 | 7.98 | 10 |
| Canada | 8.57 | 5 | 9.15 | 12 | 7.98 | 10 |
| Ireland | 8.50 | 8 | 8.94 | 21 | 8.07 | 5 |
| New Zealand | 8.89 | 1 | 9.28 | 6 | 8.49 | 3 |
| United Kingdom | 8.50 | 8 | 9.00 | 18 | 8.00 | 9 |
| United States | 8.39 | 17 | 8.75 | 28 | 8.03 | 6 |
| Hong Kong | 8.78 | 3 | 8.59 | 32 | 8.97 | 1 |
| Singapore | 8.16 | 25 | 7.48 | 62 | 8.84 | 2 |
Note: The human freedom scores are an arthmetic average of scores for personal and economic freedom
Source: Vasquez and Porcnik (2018)
All eight countries score and rank well within the top quartile of the 162 OECD countries.
Many domestic academics and interest groups do not view New Zealand's high ranking for economic freedom positively. For some, it is evidence of what has gone wrong in New Zealand – in a word, neo‐liberalism. There is endless pressure for more government spending on welfare, health, education, the environment, job training, housing, or the regions, along with pressure for more intrusive regulation of business.
Yet the ‘more market’ view is strong in the business community and has a small representation in parliament.
The centralist National‐led government of 2008–17 was much closer to the business community than either the Labour‐led government of 1999–2008 or the current Labour‐led government, which took office in 2017. Trade union influences are far stronger within the Labour Party than within the National Party.
The good news in the New Zealand story is that the 1980s reforms succeeded in the sense that fiscal stability has been sustained with low inflation and a growing open economy. Yet all is not well: the opposing views about the direction of the redistributive state are an ongoing source of policy instability and tension in New Zealand.
Background: From 1930s socialism to post-1984 liberalisation
The searing global depression of the early 1930s deeply scarred New Zealand's psyche. As a small open economy, New Zealand was heavily exposed to global events affecting the demand for a narrow range of land‐based exports. (To a lesser degree it still is.)
Despair over the inability of the 1930–35 governments to deal with the problem saw New Zealand electing its first Labour government in 1935. Its radical element favoured socialising the means of production, distribution and exchange. Labour did introduce some nationalisation, but it is more accurately described as a big‐spending social democratic government. It was more intent on cradle‐to‐grave social security in the name of ‘social justice’ than on eliminating economic freedom. This legacy endures in the form of much increased taxation and welfare spending, but perhaps not in reduced angst about hardship and inequality.
The new government was fortunate to take power at a time when international markets for New Zealand produce were improving. Nonetheless, it ran into a serious foreign exchange crisis in 1938. Already inclined to protectionism as an industrialisation strategy, the government responded by imposing blanket import licensing as a ‘temporary’ measure. The comprehensive wartime controls that soon followed entrenched that arrangement. Protectionist import licensing and tariffs were not successfully challenged until the next serious foreign exchange crisis, which arrived in 1984.
The need for additional revenue to fund wartime spending also readily justified large revenue increases that became permanent. The government set out to “tax to the economic limit” – ostensibly to stop wartime profiteering by men not conscripted (Goldsmith, 2008, p. 195).
Following the end of World War II, Labour's supporters were divided on the issue of peacetime conscription. Labour lost the 1949 general election to the National Party. In 1951, the communist‐influenced trade union movement overreached its power in attempting to bring the country to its knees. The militant waterfront union confronted the government with a major and prolonged strike, but it split the union movement and lost the battle.
One of the first Labour government's lasting legacies was a major increase in the proportion of the population receiving a benefit from the state. For the elderly, there was a universal pension. For young couples, there was a universal family benefit and extensive government assistance for housing.
Most fees for health services were removed.
Historians have tended to view Labour's well‐intentioned policies kindly.
Cradle‐to‐grave social security was a laudable aspiration, but at least one academic, Harvey Franklin (1978), attributed the joint rise of protectionism and welfarism to anxiety amongst New Zealanders about their vulnerability in a world that could produce such devasting depressions.
The National government elected in 1949 was more pro‐business than Labour, but it pragmatically maintained Labour's protectionist trade policies and much‐increased tax rates (see Figure 1). It also entrenched the expanded role for the state while in power for 29 of the next 35 years.
Figure 1: Central government taxation, 1890-2018
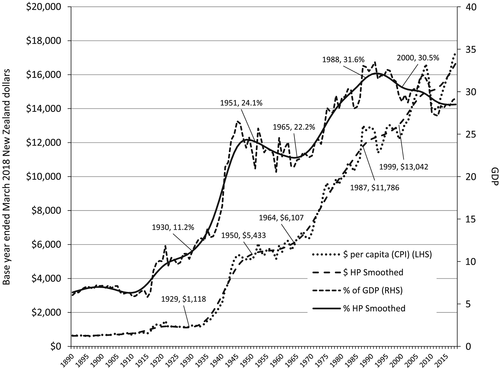
Note: HP, Hodrick-Prescott filter. CPI, Consumer Price Index. At 31 December 2018, £1 = NZ$1.890 (Reserve Bank of New Zealand).
Source: Statistics New Zealand; New Zealand Treasury; authors calculations
A third Labour government was in power between 1972 and 1975. It was also a big‐spending government. It lifted central government financial net expenditure from 24.8 per cent of GDP in the year ended March 1973 to 31.0 per cent in the year ended March 1976 (Treasury, 2018).
The next National government (1975–84) wrestled with the problems of large fiscal deficits, large balance of payments deficits, low export prices relative to (OPEC‐swollen) import prices, stagflation, and rising unemployment. In 1982, eschewing the monetary restraint approach of the Thatcher government in the UK and the Reagan administration in the US, New Zealand adopted blanket price, wage, interest rate, and rent controls as disinflationary measures. To buy political support from the trade unions it cut income tax substantially, thus increasing the fiscal deficit and exacerbating the growing public debt problem.
In the year ended March 1984, the New Zealand government's net financial deficit comprised 6.1 per cent of GDP.
As Figure 1 shows, this was not caused by lack of diligence in increasing tax burdens substantially. Rather, it was caused by much greater spending growth. A significant factor was a 1975 general election promise to pay immediately a universal ‘superannuation’ benefit to everyone aged 60 or more, without means‐ or asset‐testing them.
New Zealand's currency crisis of July 1984 was the culmination of prolonged fiscal deficits, spiralling public debt, artificially low interest rates, a fixed exchange rate, and an incoming Labour government that was expected to do the obvious – devalue the currency. The new government in July 1984 had no sound option but to devalue. It also had to free up interest rates to defend the new rate for the New Zealand dollar. Both imperatives undermined the wage and price freeze. This government and its successors spent much of the next decade battling to stabilise the government accounts, eliminate inflation, and free up private economic activity. New Zealand's liberalising reforms were informed by the reforms in Australia under the Labor government of Bob Hawke (1983–91). From an economic management perspective, this programme represented a return to OECD orthodoxy (Henderson, 1996).
The public accounts recorded a small surplus of 0.9 per cent of GDP on the government's cash basis in the year ended June 1994.
This represented a turnaround of seven percentage points of GDP from the 1984 deficit. On the author's analysis, 69 per cent of this turnaround (4.9 percentage points of GDP) came from revenue increases. Most of the remainder (1.3 percentage points) came from reduced finance costs as a percentage of GDP. Remaining expenditure items contributed only 0.8 percentage points of GDP (11 per cent) to the fiscal turnaround (Wilkinson, 2017).
New Zealand's unemployment rate peaked at 11.2 per cent at the height of the recession during the restructuring process. Arguably, restructuring costs would have been lower if more of the fiscal consolidation had been achieved by expenditure reductions. Much government spending is ill‐justified but entrenched, a legacy of wartime ratchet effects and cradle‐to‐grave socialist enthusiasm.
To be clear, the view that fiscal consolidation was achieved by slashing social spending is a myth. On the Treasury's figures, spending on each of the three big ticket items – social security, welfare and superannuation; education; and health – rose as a percentage of GDP between 1984 and 1994. The combined rise amounted to 2.2 percentage points.
From this perspective, the statists won the battle over the size of government from the mid‐1930s to the mid‐1990s and beyond (see Figure 1), even if they do not see it that way.
In contrast, both the statists and the market liberals agree that major liberalisation had occurred. The Fraser Institute has usefully extended its estimates of economic freedom back to 1950. Its (inevitably heroic) estimates for Australia and New Zealand are compared in Figure 2. Australia was consistently less protectionist and less socialist than New Zealand prior to the latter's 1984 reforms. It also achieved greater productivity growth and higher income per capita.
Figure 2: Australia and New Zealand, global ranks for economic freedom, 1950-2016.
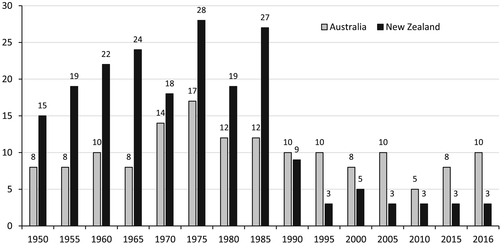
Note: 1 = most free economy
Source: Fraser Institute, Economic Freedom of the World 2018 Annual Report(Gwartney et al., 2018). Possible discontinuity between 1965 and 1970 in linked backcast series.
Aided by the dire necessity of the 1984 crisis, New Zealand's liberalising reforms went further and faster than those in Australia. New Zealand's global ranking for economic freedom went from 27th in the world to 3rd between 1985 and 1995; Australia's went from 17th in the world in 1975 to 10th in 1990. By 1995, New Zealand outscored Australia on economic freedom across all five of the Fraser Institute's component pillars – regulation, freedom of trade, sound money, legal system and property rights, and size of government.
3. Dirigisme versus freedom under MMP: 1996-2017
After 1993, New Zealand changed its electoral system for members of parliament from first‐past‐the‐post to mixed member proportional (MMP), which was modelled on the German system.
The first general election under MMP was held in 1996. No major party has enjoyed a parliamentary majority from its own members since the 1993 general election.
Enthusiasm amongst most politicians for further economic liberalisation in New Zealand had weakened by 1996.
One remarkable aspect is that the 1987 and 1990 general elections, and to a lesser extent the 1993 general election, endorsed the reformist directions set after the 1984 general election.
The 1996 general election result allowed New Zealand First, a populist minority party, to determine which of the two major parties, Labour or National, would form the next government. It eventually conferred that honour on National. The coalition between the two parties did not last the full term, but New Zealand First did allow National to limp along to complete a full three‐year term.
In the 1999 general election, New Zealand First opted to support Labour. National‐led governments took over in 2008, to be replaced by another Labour‐led government in 2017.
The 1999–2008 Labour‐led government was a big spending government with a strong ideological aversion to using rapid revenue growth to reduce tax burdens, despite inheriting cyclically adjusted fiscal surpluses.
In the year ended June 2009, real GDP per capita and real tax revenue per capita were 17.9 per cent and 25.8 per cent higher, respectively, than in the year ended June 1999. That is a revenue bonanza.
The 2005 budget was particularly spendthrift. Overall, on the Treasury's numbers, core Crown operating expenses excluding finance costs increased from 28.4 per cent of GDP in the year ended June 2000 to 32.3 per cent of GDP in the year ended June 2009, a rise of nearly 4 per cent of GDP (Treasury, 2018). The discretionary rise in spending was greater in that spending on the unemployment benefit fell from 1.5 per cent of GDP in 2000 to 0.3 per cent in 2009, as strong economic growth reduced the unemployment rate.
Labour increased spending faster than the growth in GDP across all major spending categories. But the greatest increases were in redistributive spending – transfers in cash and in kind. The proportion of non‐employment‐related working‐age benefits at year end to the working‐age population rose under its watch from 8.2 per cent in June 2000 to 8.9 per cent in June 2009 (see Figure 3). This was remarkable given the strong employment and GDP growth during this period.
Figure 3: Sickness, Invalids', Minors', Widows' Benefits and Domestic Purpose Benefits at 30 June (31 March prior to 1990) as a percentage of the working‐age population, 1940–2012.
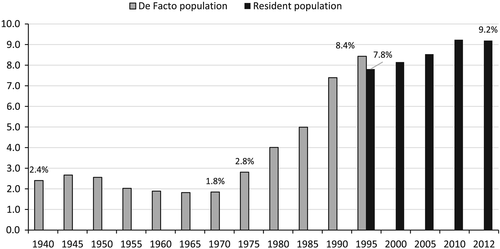
Source: Ministry for Social Development; Statistics New Zealand; author's calculations. Data series discontinued after 2012.
When Labour lost the November 2008 general election, the incoming government faced fiscal deficits for the foreseeable future and a global financial crisis. Its fiscal challenges were compounded by earthquakes in 2010 and 2011 that destroyed the centre of Christchurch, New Zealand's second‐largest city at the time.
During National's nine years in office, real tax revenues per capita and real GDP per capita were higher by only 10.3 per cent and 10.1 per cent, respectively.
It took National seven years to turn its inherited deficit into a small surplus. The surplus in the 2017 fiscal year was a more material 1.5 per cent of GDP. Unfortunately, this set the stage for a general election in 2017 built around spending spree promises.
New Zealand's productivity performance was not good during this period of government expansion. Figure 4 shows strong multi‐factor productivity growth between 1987 and 2000, with weak growth both earlier and subsequently.
Figure 4: Index of multi‐factor productivity, 1978–2017 (year ended March 1978 = 1000)
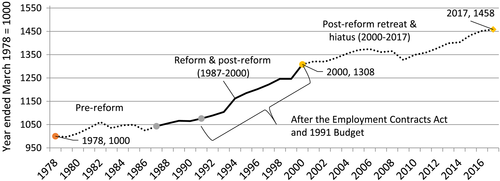
Sources: Statistics New Zealand Former Measured Sector; Capital Economics
Labour productivity growth has also slowed. The New Zealand Treasury's long‐run fiscal projection is that productivity will grow 1.5 per cent per annum. On the OECD's numbers this looks far too optimistic. Trend labour productivity growth has not been of that order since 1995. Australia has been doing somewhat better. The average annual compounded growth rate during 2010–17 for labour productivity was 0.5 per cent for Australia and 0.2 per cent for New Zealand.
Ongoing low productivity growth poses one of the biggest internal threats to the future well‐being of New Zealanders.
The level of taxation is also an issue. There is a widespread view that New Zealanders are lightly taxed. This is not true from a historical perspective (see Figure 1). Nor is it true in comparison with most other countries today. The Heritage Foundation's database for its 2018 Index of Economic Freedom (Miller, Kim, & Roberts, 2018) indicates that citizens in 135 out of 180 countries have a lower average tax burden than New Zealanders. Ninety‐four per cent of the world's population lives in those 135 countries.
Many of those 135 countries lack the preconditions for prosperity. A few are nonetheless prosperous because they are oil‐rich. Excluding countries with populations below 2 million or with GDP per capita of less than US$15,000 (on a purchasing power parity basis) enables a more like‐with‐like comparison. This filtering reduces the list to 62 countries.
Figure 5 compares the ratios of tax revenues to GDP for those 62 countries. Only 18 have higher tax ratios than New Zealand. Of these, all but one – Botswana – are European. Three and a half billion people live in those 62 relatively prosperous countries and 89 per cent of them live in countries with a lower ratio of tax revenue to GDP than New Zealand's.
Figure 5: Tax revenue ratios to GDP for 62 countries
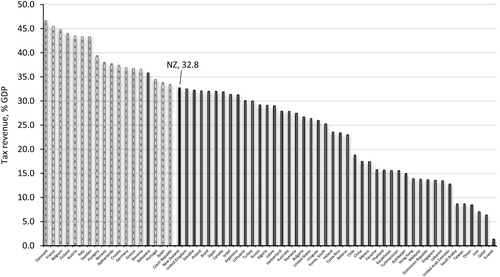
Note: Excludes countries with fewer than 2 m people and GDP per capita of less than US$15,000 (PPP basis). This left 62 countries with 3.5bn people. Of these 62 countries, 18 had a higher tax revenue ratio than New Zealand and all but one of these was European. (The patterned columns all represent European countries.) Fewer than 11% of the 3.1bn people were from countries with higher tax revenue than New Zealand's. The population‐weighted average tax revenue ratio was 23.6.
Source: Heritage Foundation database for its 2018 Index of Economic Freedom(Miller et al., 2018). Reproduced from Wilkinson (2018, p. 31).
No mainly English‐speaking country has a higher ratio of tax revenue to GDP than New Zealand, although the UK's ratio is not significantly lower. Australia's tax and spending burdens are five percentage points of GDP lower than New Zealand's. Ireland's ratio is lower than New Zealand's by 10 percentage points of GDP. The tax ratios in Hong Kong and Singapore are less than half of New Zealand's ratio.
The level of tax is also an issue because spending disciplines are poor. Successive New Zealand Productivity Commission reports have identified a lack of focus in government on public sector productivity and spending and regulatory quality. A 2013 Fraser Institute report (Di Matteo, 2013) indicated that New Zealand governments might be able to spend one‐third less for the same outcomes if they matched Korea for welfare indicators relative to government spending.
The lack of focus in New Zealand on spending and regulatory quality along with the level of spending is a plausible factor in explaining New Zealand's sluggish productivity growth and much‐increased working‐age welfare dependency ratios.
4. 2017: Time for a replay of big-spending Labour Government
The 2017 general election was dominated by campaign promises to spend the projected fiscal surpluses. Labour led this charge but still fell well short of National in the popular vote.
New Zealand First, the populist party, won enough seats to determine yet again which party would provide the next prime minister. This time it conferred the mandate on Labour. To obtain a parliamentary majority, Labour also had to reach a confidence and supply agreement with the Green Party.
Labour has moved fast to increase public spending and has been fortunate so far with positive revenue surprises.
It is increasing benefit levels and raising the minimum wage. In combination, these measures could be expected to increase working‐age welfare dependency again.
One proclaimed goal of Labour is to reduce poverty, particularly child poverty, but the government's measures seem ill‐targeted for that purpose. Raising the minimum wage is a particularly ill‐targeted means of reducing material hardship, and it is circular to define poverty as low relative to disposable income and then treat that outcome as the cause of poverty. Better results would surely be achieved if policy focused on helping people address their diverse predicaments, be they drug addition, substance abuse, family violence, mental illness, inadequate education, or lack of access to jobs or health services. Lack of money and work can be a symptom of problems rather than a cause.
The previous National‐led government's ‘social investment’ approach used trials to find out which social service programmes really were effective in helping people overcome their difficulties. There are grounds for hope that the Labour‐led government will continue the effort, at least in part.
Labour's enthusiasm for signalling its willingness to loosen taxpayers' purse strings has rekindled enthusiasm amongst interest groups in receiving benefits at the expense of others. One embarrassment for it is that public‐sector unions have seized the opportunity to demand substantial wage increases, regardless of productivity.
To buy New Zealand First's support, the government has set up a ‘regional development’ fund. This allows the government to spend NZ$1bn a year of taxpayers' money on projects it (largely New Zealand First) considers politically worthwhile. This is partly related to its gratuitous commitment to plant one billion trees by 2028, at an average rate of 100m trees a year. It has also launched a programme to build or deliver 100,000 state‐sponsored new dwellings in the next decade. No case has been made for how this constitutes a serious response to the housing affordability problem in New Zealand.
On the regulatory side, many measures already in place or pending will reduce economic freedom, whether captured on the international measures or not. Examples include:
- increases in minimum wages that must be expected to make it harder for the least employable to get work;
- depriving children from the bottom socio‐economic groups of the freedom to be educated at non‐government partnership (charter) schools, apparently purely for ideological/state teacher‐union reasons;
- depriving home owners of the ability to get the best price for their homes, if the buyer happens to be from overseas, defined so broadly as to include New Zealanders living abroad;
- closing offshore petroleum exploration to appease the green constituency, without due consultation or any official supporting public interest analysis;
- moves to raise landlord costs through more restrictive quality regulation and perhaps more extensive taxation, which are surely more likely to reduce than raise the ability of less attractive tenants to find private‐sector accommodation;
- restrictive pro‐union labour market legislation aimed at markedly reducing the freedom of workers and employers to negotiate their own terms, particularly in small‐ and medium‐sized enterprises;
- proposed measures to reduce the influence of school boards of trustees in favour of greater bureaucratic centralisation and control;
- setting arbitrary, ‘virtue‐signalling’ renewable energy and emissions targets to be achieved with greater command‐and‐control regulation, but with no attempt to demonstrate that the benefits to New Zealanders could be expected to exceed the costs; and
- making New Zealand less open to foreign direct investment more generally by increasing the ability of the regulatory process to extort concessions from foreigners as a condition of gaining consent.
On the positive side, the government is aware of the need to reduce the regulatory barriers to the supply of land for residential housing. Whether its measures to improve supply will increase economic freedom remains to be seen. In addition, Labour is seeking to sustain fiscal surpluses. The risk, however, is that it will take continuing economic growth for granted and make ongoing spending commitments on this basis. That will likely mean a period of spending largesse will be followed by a prolonged struggle to restore fiscal order.
5. Concluding observations
New Zealand seems to have achieved a pragmatic but unsatisfying political equilibrium under MMP. The electorate no longer chooses which party will form the next government. That outcome is determined by post‐election negotiations in which minority parties can hold utterly disproportionate power.
Government operational spending these days is overwhelmingly redistributionist. Only about one dollar in six is spent on collective consumption.22
General election campaigns are dominated by proposals for further redistribution, often focused on symptoms rather than causes. The countervailing consideration is that, as a small open economy, New Zealand needs its export industries to be internationally competitive without subsidies.
New Zealand's political outcomes seem destined to oscillate between these two tensions, satisfying only those who are broadly happy with the relatively high tax/low income status quo along with higher levels of economic freedom than in the past.
For the moment the political pendulum has swung in the dirigiste direction, and revenue growth is once again supportive. Labour squandered the tax revenue bonanza between 1999 and 2008 – and could well do so again, given the opportunity. Labour has not demonstrated any serious interest in policies to lift future productivity growth, and thereby overall future well‐being. The redistributive objective is to the fore.
There may be insights from the New Zealand experience for restructuring the traded goods sector and fiscal issues the UK will likely face with Brexit. Others better placed than the author can judge that, but the New Zealand experience indicates that old policy disagreements and instability endure even when restructuring is successful.
You can find the online journal column here.
Dr Bryce Wilkinson is a Senior Fellow at The New Zealand Initiative.